Great business decisions start with great insights—but too often, it can be hard to find the signal in the noise, especially when the data spans different areas of the business. Today, Spotlight Reporting is bringing new innovation to financial reporting with the launch of Tracking Category Reporting (including Tracked Budgets).
Now you have the flexibility you need to import, freely explore, and report on the performance of divisions, departments, locations, or any other meaningful breakdown.
“Tracking Category Reporting will give accountants and CFOs the power to do more in-depth analyses by using existing data to produce new insights, not to mention the ability to now import tracked budgets. All without having to jump into a spreadsheet”.
Matt Kekana, Spotlight Reporting Product Manager
But first, what are Tracking Categories?
Many business owners have certain areas of their business that they want to keep a close eye on. Using Tracking Categories in Xero (called Locations & Classes in QuickBooks) allows for grouping of income and expense data based on common characteristics; take a look at some common examples below. By using Tracking Categories, you’ll have more clarity on how different areas of the business are performing.
Here are some common examples of how Tracking Categories can be applied:
- Profit Centres: restaurant, takeaway, and Uber Eats
- Locations: Online store and brick-and-mortar store
- Types of work: tax, audit, and consulting work
- Product lines: garden, hardware, and tools
- Departments: Sales, Marketing, and Finance
Visit either the Xero or QuickBooks Online help center for more information on how to get started with Tracking Categories or Locations & Classes.
Data superpowers for Accountants and CFOs
Importing Tracking Category data has been possible for a while now in Spotlight. The big innovation we’re launching today is the ability to utilise the data once it has been imported from your source of truth.
📊 Slice and dice your data
Once you’ve imported Tracking Categories for your organisation, you can filter your data any way you choose. Let’s say you’re preparing a report for a restaurant with three Tracking Categories: restaurant, catering, and delivery. You can instantly filter your report, pages, or charts to see data from any of these options:
- All three options;
- Two options, e.g. catering and delivery only;
- A single option, e.g. restaurant only
You have complete control over the data you want to display in reports, and can find the exact metrics that matter most.
🔎 Find meaningful insights with Tracked Actuals vs. Tracked Budgets
Budget vs. actual analysis is a financial reality check for businesses. Now you can go to the next level and compare tracked budget vs. tracked actual data from Xero or QuickBooks Online.
Want to do a deep dive into your Sales and Marketing departments’ performances? Or maybe look at how your Australian operations are tracking against budget? This new level of business area granularity will reveal trends that could otherwise go unnoticed, so you can adjust tactics accordingly.
Tracking Category Reporting in action
The possibilities for Tracking Category Reporting are endless.
To better understand how it might work for you, let’s work through an example that could apply for a large number of businesses: Locations.
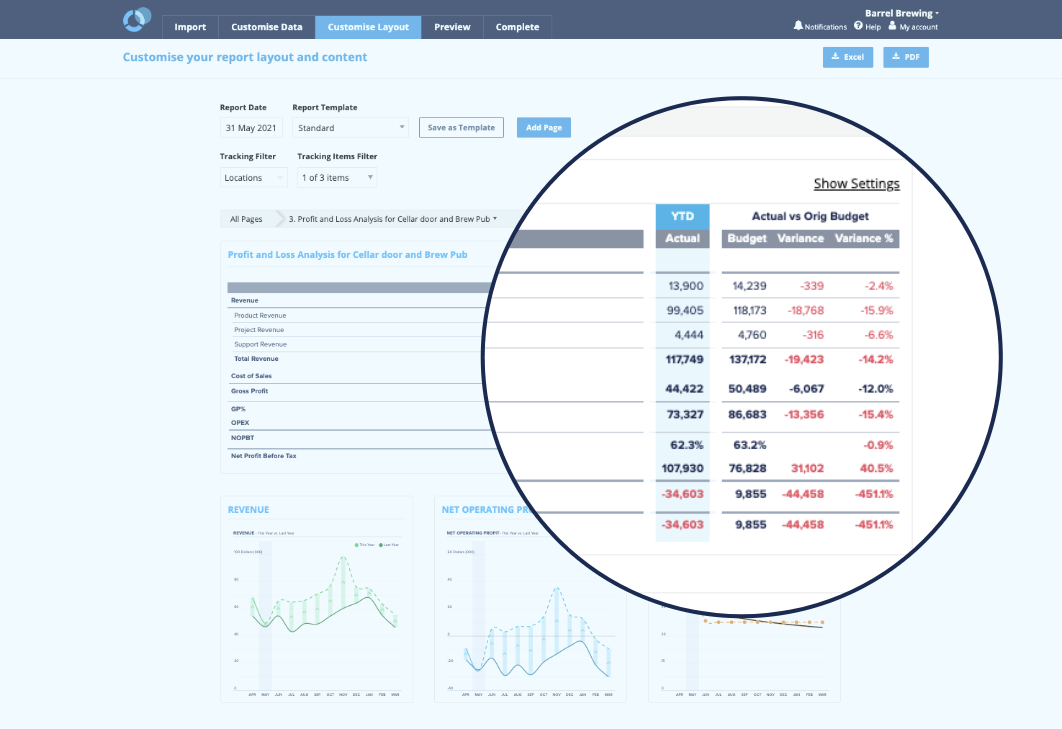
An example: Barrel Brewing 🍻
This business has three locations: a Brewery, Cellar Door, and Brew Pub. As part of their quarterly review, they want to see how the Cellar Door and Brew Pub are performing against their budgets to see if they’re on track to hit or miss their targets.
Here’s how they’d go about it:
1. Import data from Xero or QuickBooks Online. Select “Include Tracking Actuals” and “Include Tracking Budgets”.

2. Once your data has been imported, jump across to Customise Data and match each Tracking Category option with its respective budget.
3. Navigate to the Customise Layout screen, and then customise your Profit & Loss to include the Actual vs budget, $ Variance, and % Variance values. Voila! Now the Profit and Loss page will show actuals vs. budget for the Cellar door and Brew Pub.
Now it’s your turn
We know Tracking Category Reporting will be a huge step forward for so many CFOs and Accountants. See what it’s like for yourself 👇
- Already use Spotlight Reporting and Tracking Categories? Log in, re-import your data, and you’ll see the new Tracking options.
- If you’re a newbie to Spotlight Reporting, watch one of our on-demand training webinars, start a free trial, or request a demo and learn how to build the ultimate report.
- Have questions? Take a look at our Help Centre article for more detailed steps or watch the video below.
What’s next?
Needless to say, we’ll keep building out our reporting experience from here–we’ll be releasing even more powerful reporting capabilities in the months ahead so that you can explore your data more deeply.
We'd love to hear your thoughts about Tracking Category Reporting, so please email customer@spotilghtreporting.com to share your ideas and feedback.
Happy reporting!


.jpg)