We know that managing and measuring the success of an Ecommerce business can be challenging. There’s data coming in from all angles and it’s hard to know which metrics to focus on.
Enter the new custom-built Ecommerce Industry Template in Spotlight Reporting 🥳

We’ve crafted this new Industry Template to help you capture and visualise the right key performance indicators (KPIs), so you can grow your (or your client’s) online business. Wave goodbye to your report setup time, and get beautiful reports in the hands of your clients or stakeholders with just a few quick clicks.
Want to learn more about our other Industry Templates? Read our getting started blog post.
What are Ecommerce KPIs?
KPIs are the metrics that are most relevant and valuable to the business.
Are you allocating online advertising budget wisely? Is the cost of acquiring customers too high? Are customers happy with the product offering and service? Tracking the right KPIs gives you the insight you need to answer these questions with confidence.
Combine your analysis skills and our Industry Template, and you’ll be set up to interpret the KPIs and draw out actionable insights to achieve long-term success.

The Top Ecommerce KPIs to Track
Which KPIs should you measure for Ecommerce businesses? We’ve broken down our Industry Template into three key areas to make understanding and applying these KPIs easier.
These three areas will provide insights to measure the success of most Ecommerce businesses, regardless of their online maturity. Let’s jump in 👇
Sales Metrics
- Sales Conversion Rate
The percentage of visitors that actually end up purchasing from the business. This allows you to see how effective the business is in converting visitors to paying customers. - Average Order Value
The average value of each order during the period. This helps businesses understand their customers' purchasing habits, as well as the effectiveness of marketing efforts and pricing strategies to improve sales. - Average Order Per Customer
The average order value per customer. This helps visualise the effectiveness of brand promotion and loyalty programs in driving sales. - Sales Transactions
All sales transactions.

Sales Analysis
- Customer Acquisition Cost
The monthly cost for acquiring new customers each month. - Cart Abandonment Rate
The percentage of customers who add items to their cart and then abandon the purchase. This can indicate the payment process is too difficult or time consuming for customers. - Return on Advertising Investment
The sales generated from each dollar of advertising investment. Shows how effective the advertising is in generating sales for the business. - Refund and Return Rate
The percentage of orders returned or refunded. High refund and return rates can indicate customer dissatisfaction with products, and the need to improve product quality or product information.
Customer Metrics
- New vs. Returning Customers
The percentage of new and returning customers. This can indicate how satisfied customers are with the product, price, and experience, so that they are willing to shop again. - Customer Satisfaction Rating
Measures the satisfaction gained from customers based on their experience of your services and products provided. - Net Promoter Score Segments
The net promoter score by segment. Reveals the proportion of customers satisfied, dissatisfied or ambivalent about the business. - Net Promoter Score
The monthly net promoter score. Reveals the willingness of customers to promote the business to others.
.png)
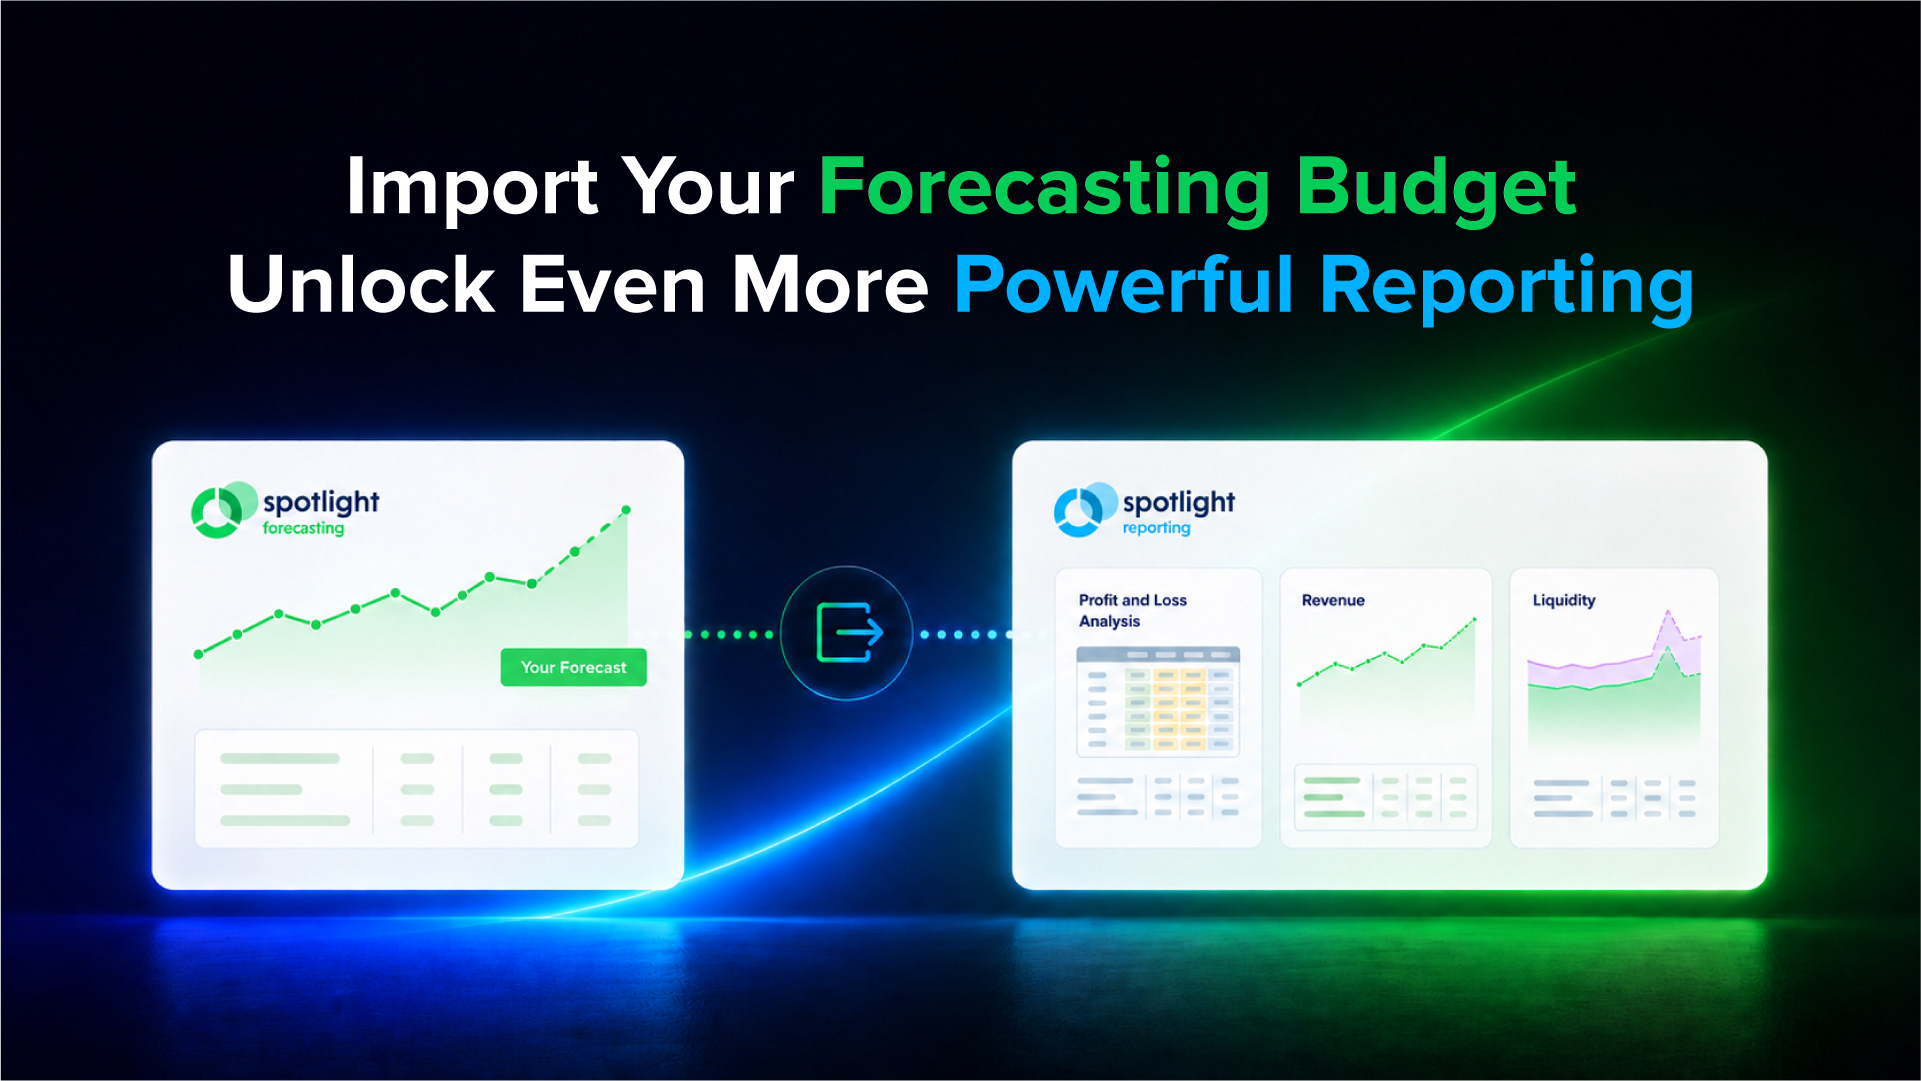
Using the Ecommerce template
Easily import data from accounting software, Excel, and other sources into Spotlight Reporting, and then watch the data auto-populate visual and easy-to-read charts.
✨ Pro Tip: Have you tried our Google Analytics integration yet? Add a Google Analytics page to your next Spotlight report to visualise website acquisition and behaviour metrics.
We’ve made sure all our templates reflect the problems you need to solve every day. If there’s something you’d like to see included in a template, please let us know.