This year was a busy one for us, and one we’ve enjoyed immensely. One aspect of our work we’re always proud of is our product innovations. In 2022 we’ve rolled out a number of important updates to make our Reporting and Forecasting capabilities all the better. Speaking of, your feedback and engagement helps us to make our products what they are, so always feel free to reach out to our team with any input or ideas.
Let's dive into some of our most exciting releases from 2022.
Balance Sheet Account Groupings
Grouping related accounts on the Balance Sheet is available, to deliver greater flexibility and customisation options for improved readability and analysis of reports.
Focusing on the information that really matters, you’re able to group accounts together under a subheading, group low importance or low value accounts under a single line to streamline a report, and re-order the accounts in the way that makes sense to you. You can also save the layouts quickly and re-use them on another page of the same type for the organisation.
.gif)
Improved Forecasting with Task Manager and Workflow
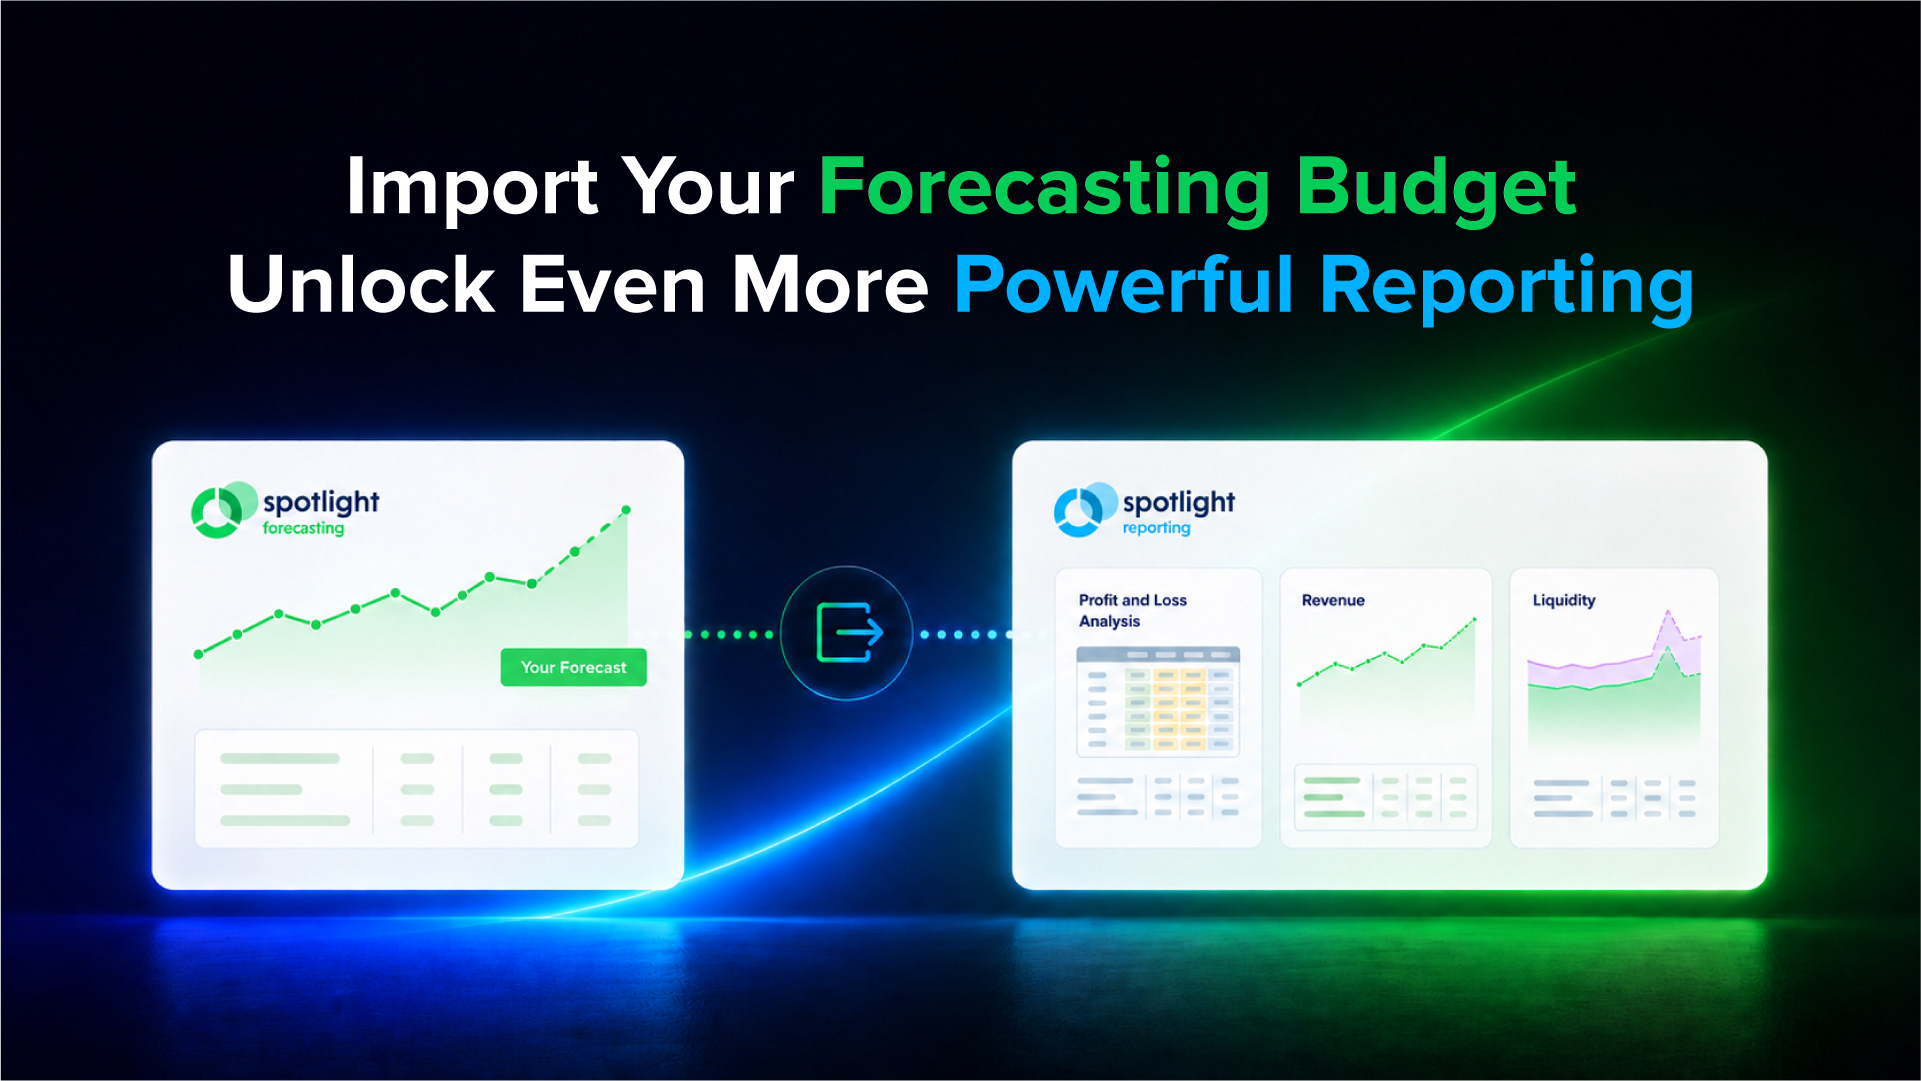
With improved convenience, speed, and usability it's now easier to create, import, and edit your budgets and forecasts.
We've also increased the number of tasks from 7 to 30 to ensure you can do more with less, and made it easier and clearer to create a Three-Way Forecast or P&L Budget within your workflow.

Desktop Connector (Hosted)
Our new Desktop Connector for QuickBooks Desktop, MYOB Desktop and Sage 50 Desktop gives you greater flexibility to initiate imports.
Even if you’re working on a different computer to where your accounting software and data is installed, you can now remotely access your desktop data and import it through our browser-based interface.

Data Labels on Charts
Many of our product updates and innovations are focused on simplification. Spotlight users are able to display data labels on charts and highlight the exact value of each data point, rather than comparing the data point to the y-axis alone.
This helps in a big way to improve the clarification and understanding of the information being presented, driving data-backed decision making.

That's not all we did though. The Product Team also worked hard to deliver other key features in 2022 including:
- Custom Tags within the Executive Summary
- Two Monthly Reporting Charts
- Organisation Filters
- Forecast Drivers Output
Over and out!
As always, our Release Notes page is a great way to stay up to date with all of our latest releases and updates.
Throughout all of the changes of the past few years, and the evolving needs of our users, we’re proud of the work we’ve done and the community we’re engaged with and striving to serve. Over this holiday period we hope you have a wonderful time however you choose to spend these summer days, and as always thank you for your trust and support.
Come 2023 you can bet we’ll be back and better than ever, refreshed from a welcome break and ready to hit the ground running. We’ll see you out there!