As we begin to wind down for the holidays, it’s time to reflect on the year that’s been. And wow, what a year! We released some stellar content, including our biggest piece of industry research to date—but the real stars of our show, as usual, were our product releases. The Product Team worked hard to deliver some key features this year—so without further ado, here it is: our product roundup for 2021.
Tracked Category Reporting
You asked, we answered! After listening to feedback from our community, this year we launched Tracked Category Reporting (including Tracked Budgets). With this release, you now have the power to import, explore, and report on the performance of divisions, departments, locations, or any other meaningful segment of your business.
Available for Xero (“Tracking Categories) and Quickbooks (“Locations and Classes”) data sources.
Copy a Page
Our reports and forecasts are now more customisable than ever with the ability to move and copy report pages.
By using the ‘Make a copy’ button, you can now duplicate any page in your report, rename it, and position it where required.
For further customisability, we also released the Move and Copy Chart function, so you can duplicate, rename, and reposition charts too.
Arrange information in a way that makes sense to you, your team, and your stakeholders!
Eliminations in Consolidated Forecasting
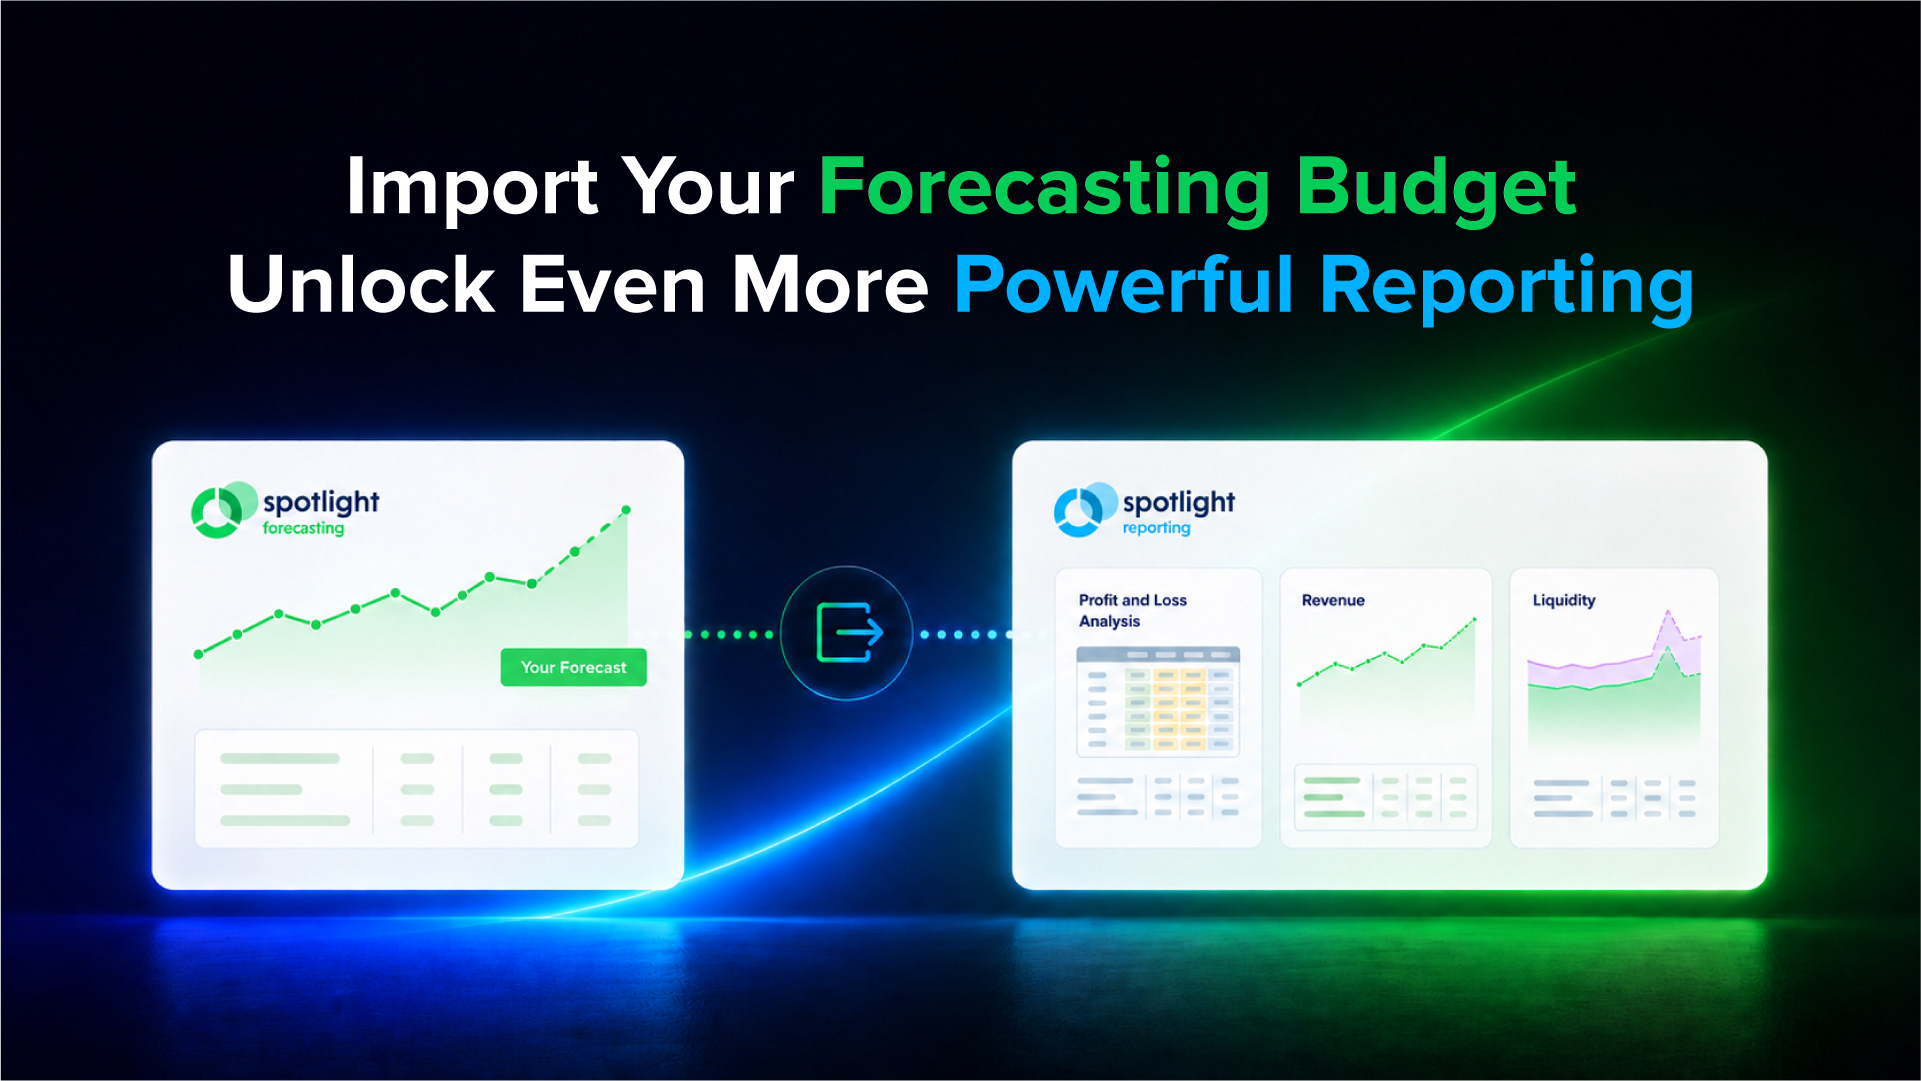
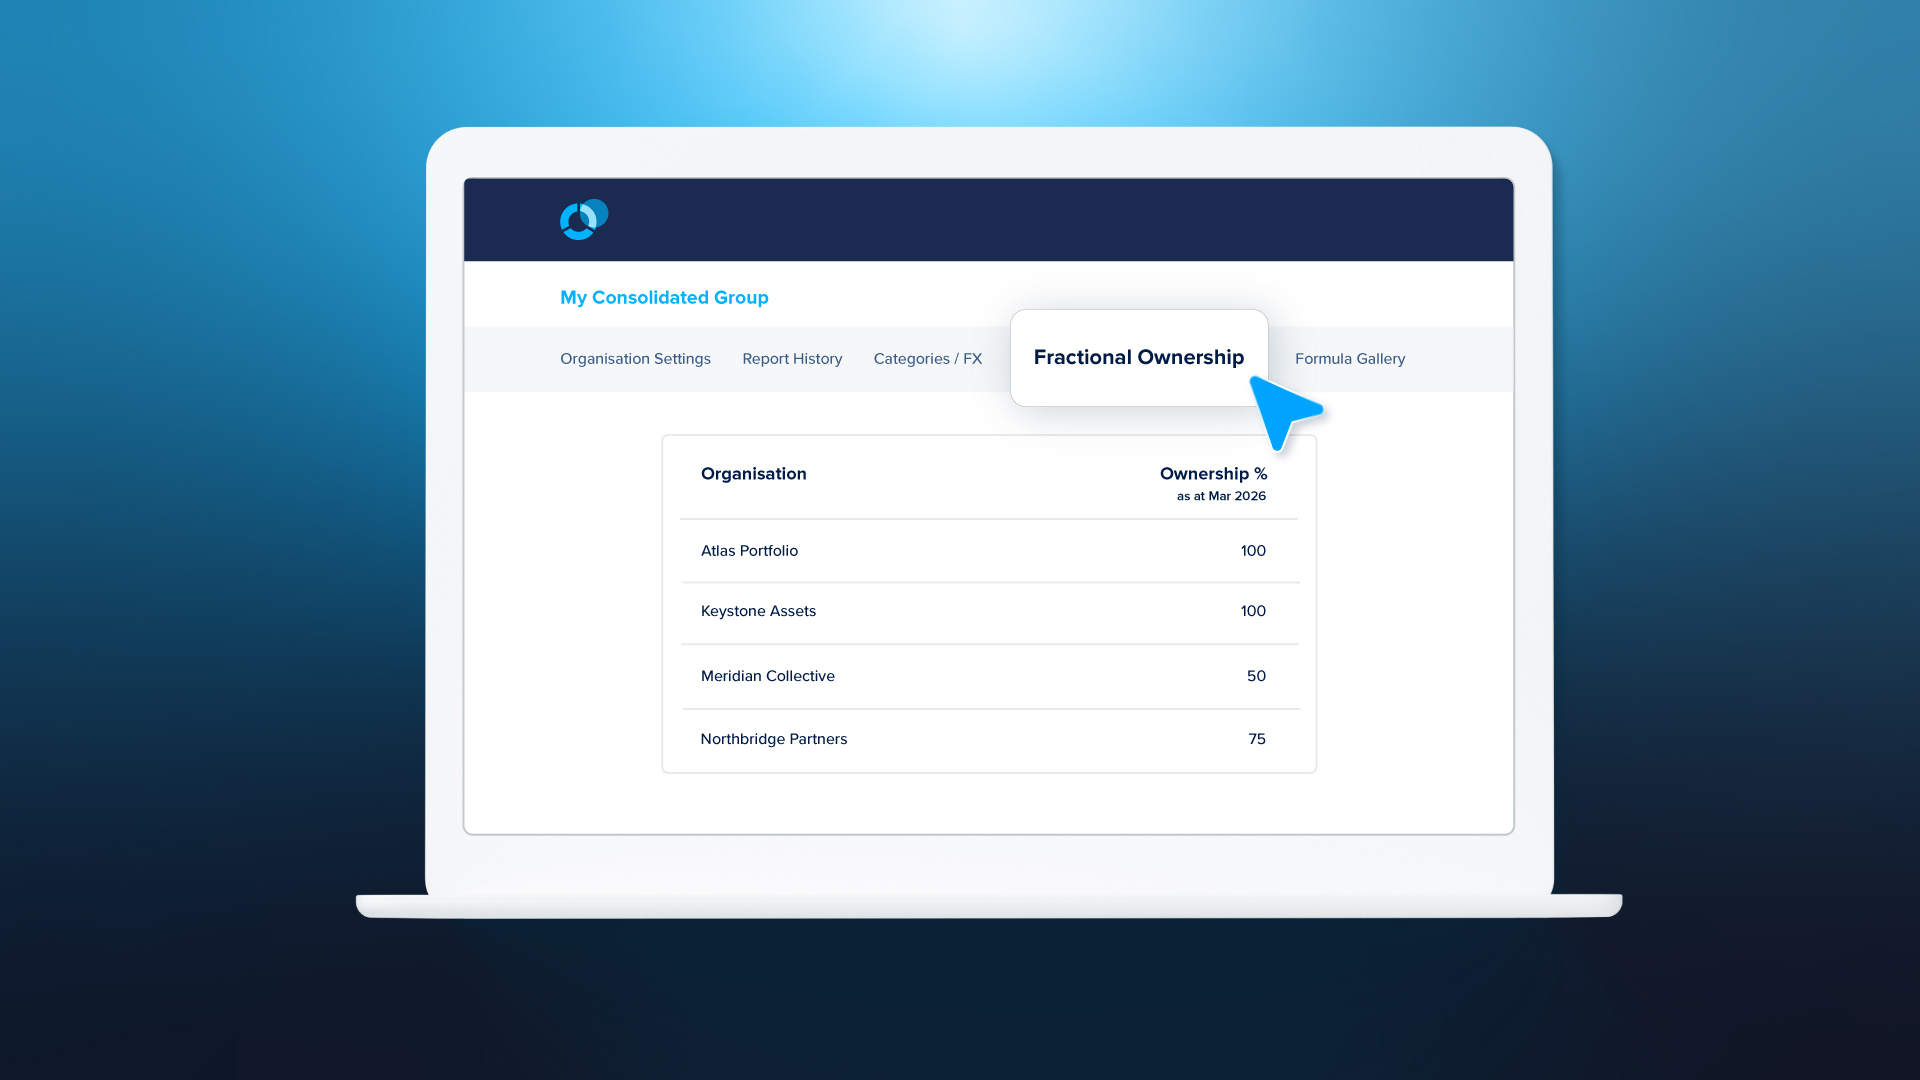
Our biggest release in recent years just got even more efficient with the release of Eliminations in Consolidated Forecasting.
Using the new Eliminations functionality is a (seriously) quick and streamlined way to cancel out balances within a group forecast. Whether it’s eliminating loans made from one entity to another, or accounting for inter-entity trading across multiple currencies, you’ll have no trouble forecasting your group cash flow position.
Second Layer of Nesting for Profit & Loss Analysis Page
As part of our Account Grouping feature, we've now added a second layer of nesting to the Profit & Loss Analysis page!
By grouping non-essential accounts and highlighting important ones, it's now easier than ever to sift through the data and find the insights you need.
What’s New?
You may have noticed the new layout of our login page in recent months. Now you can easily keep on top of Spotlight Reporting’s latest and greatest with the What’s New section.
Each new release textbox contains a quick feature summary, and occasionally an option to learn more about it in our Help Centre.

Custom Colour Picker for Charts
When it comes to visualising data, carefully selected chart colours can catch a reader's attention and bring the numbers to life. Choose any chart colour you like with our Custom Colour Picker, and tell the story that will make all the difference.

And that's a wrap!
To say that 2021 has been a rollercoaster of a year would be an understatement. But we’ve been lucky enough to have the support and feedback of our global community, and this has really pushed us to keep innovating. To see a full list of all our 2021 product releases, you can visit our release notes page.
Thank you for your support, and for trusting us with your reporting and forecasting needs. From all the team at Spotlight Reporting, we wish you a Happy Holiday, and we’ll see you in the new year.